Oklahoma Seismicity Data Analyses
For this assignment, I was tasked with utilizing the built in tools in Matlab to analyze the seismic data within Oklahoma and create two figures to represent these data. By creating these figures, it provided an insight into the seismic activity trends in Oklahoma for the past 5 years, and helped draw some conclusions as to their patterns and history.
Below is a improvised map of Oklahoma and the seismic data recorded from 2010-2015 in the state to provide a visual as to how the seismic activity was dispersed over time.
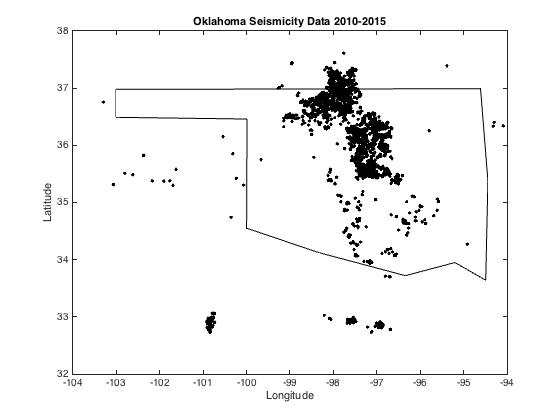
It's fairly clear that there is a consolidation of seismic activity in the center and just north of center of Oklahoma, and any other sources of activity follow a fairly consistent North-South trend line. Without any background information or knowledge on the history of seismicity in the area, it could be assumed that a sizable fault line or tectonic feature runs through the center of Oklahoma.
To go along with the image above, using Matlab I also created a histogram showing the number of earthquakes in Oklahoma over the 2010-2015 span of time the data provided.
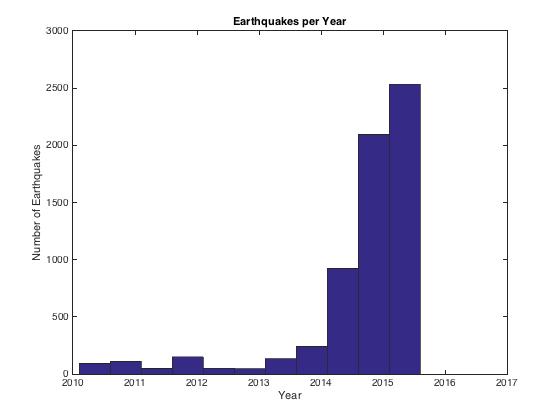
Based on the histogram breakdown of the seismicity data, it shows that since 2010, the frequency of earthquakes in Oklahoma has steadily rose and reached a peak most recently. This could be a simple seismic trend, an unforeseen increase in activity due to some tectonic action, or it could be due to anthropological factors such as fracking injections or mining operations. Back around 2010-2013, the depth of the seismic activity was fairly consistent and didn't vary as greatly as it did this year in 2015.
To observe how I created these figures in Matlab, I have provided a download link for my Matlab scrip that shows the process and includes comments to label the important steps.
Oklahoma Seismic Data Matlab script